Monitoring in the Upper White and Upper Illinois River Watersheds
Gallery for Upper White and Upper Illinois River Watersheds
Follow our research on flickr!

Funding Agency
Arkansas Natural Resources Commission
Project timeline
2009-2018
Purpose
The Arkansas Natural Resources Commission and many other water resource stakeholders are interested in the water quality of two priority watersheds – the Upper White River Basin (UWRB; HUC 11010001) and the Upper Illinois River Watershed (UIRW; HUC 11110103). These two watersheds are in State-designated nutrient surplus areas, where nonpoint source pollution is a concern, namely excess nutrients and sediments from agricultural and urban land uses.
Objective
This project is ongoing and has been funded in various ways in an effort to generate a long-term water quality database. During the recently completed grant from ANRC, we collected samples almost weekly from 15 sites, and measured 7 parameters including nutrients, sediments and ions (chloride and sulfate). That totals almost 5,000 analyses done during the last 3 years of monitoring!
Goal
Northwest Arkansas has been going through major land use changes for the last couple of decades. The goal of this project was to gather more years of water-quality data in order to evaluate trends at each site – that is, to look at how water quality might be changing over time (see map below). Long-term (as in several years or even decades) of data are needed to properly evaluate trends because of year-to-year differences in flow (drought versus dry years) and the lag time between the implementation of best management practices or other landscape changes and the water-quality response.
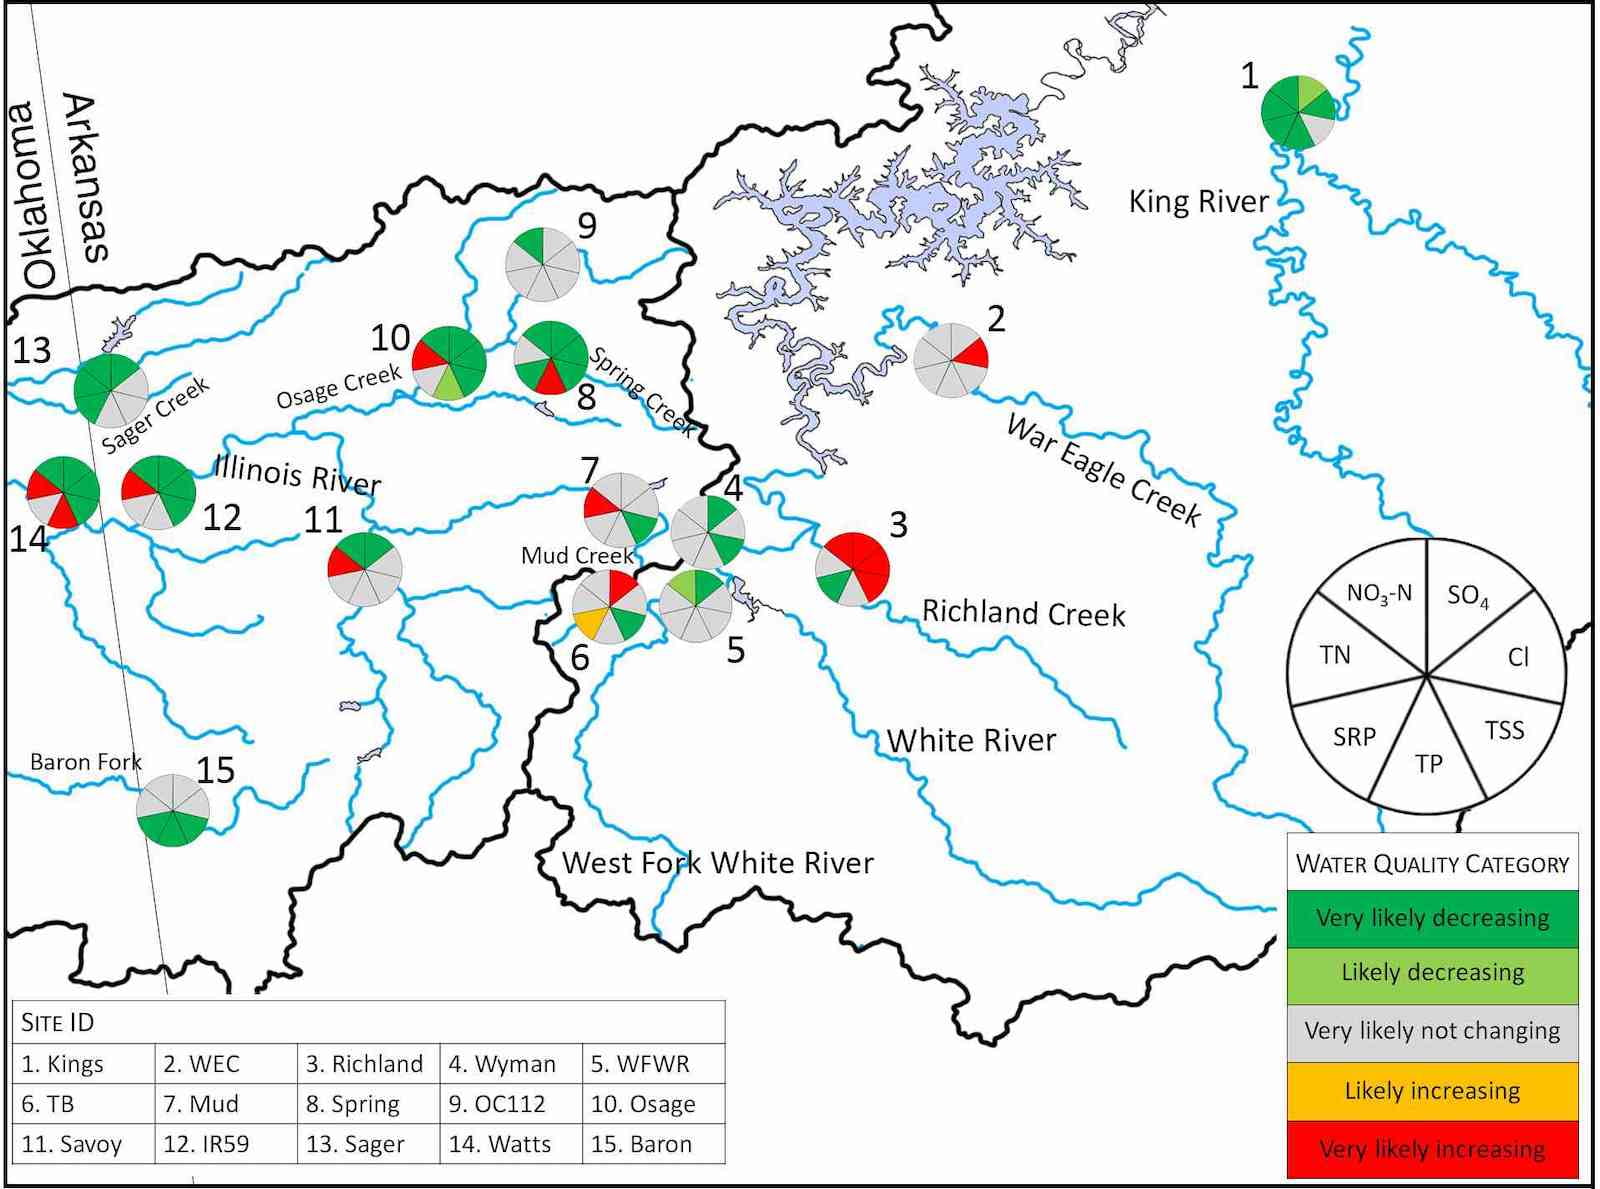
Map of the UWRB and UIRW in Arkansas showing water-quality trends for several parameters. SO4=Sulfate; Cl=Chloride; TSS=Total Suspended Solids; TP=Total Phosphorus; SRP=Soluble Reactive Phosphorus; TN=Total Nitrogen; NO3-N=Nitrate. Data are from the final project report, publication number MSC387 which can be found on our publications webpage.
Benefits
Data from this project can be used to evaluate the effectiveness of NPS projects aimed at reducing nutrient and sediment loads and to help calibrate and validate models that can be used for future planning. This information also can provide insight into where additional resources should be targeted, or identify potential emerging water-quality problems.
Additional Resources
All of our past project reports and the water-quality data reports are available to everyone on our website. Visit the MSC Publications page to read past project reports and the Water-Data Reports page to download a Microsoft Excel file containing the complete water-quality data.
Click the sites below for specific water-quality information!
Upper Illinois River Watershed
Ballard Creek near Westville, OK ("Ballard")
The Ballard Creek watershed at this site is 57 km2, draining 28% forested lands, 64% pasture and grasslands, and 8% urban development in the Upper Illinois River Watershed. Ballard Creek is an important site in the Illinois River Watershed because of it’s large percentage of pasture land use. We stopped monitoring this site in summer 2015.
What were the trends between 2009-2015?
- Chloride and sulfate were increasing.
- All other parameters were neither increasing or decreasing.
See the report for more information.
Baron Fork at Dutch Mills ("Baron")
The Baron Fork watershed at this site is 106 km2, draining 46% forested lands, 50% pasture and grasslands, and 4% urban development in the Illinois River Watershed. Baron Fork is a large tributary to the Illinois River and flows into the Illinois just upstream of Lake Tenkiller in Oklahoma.
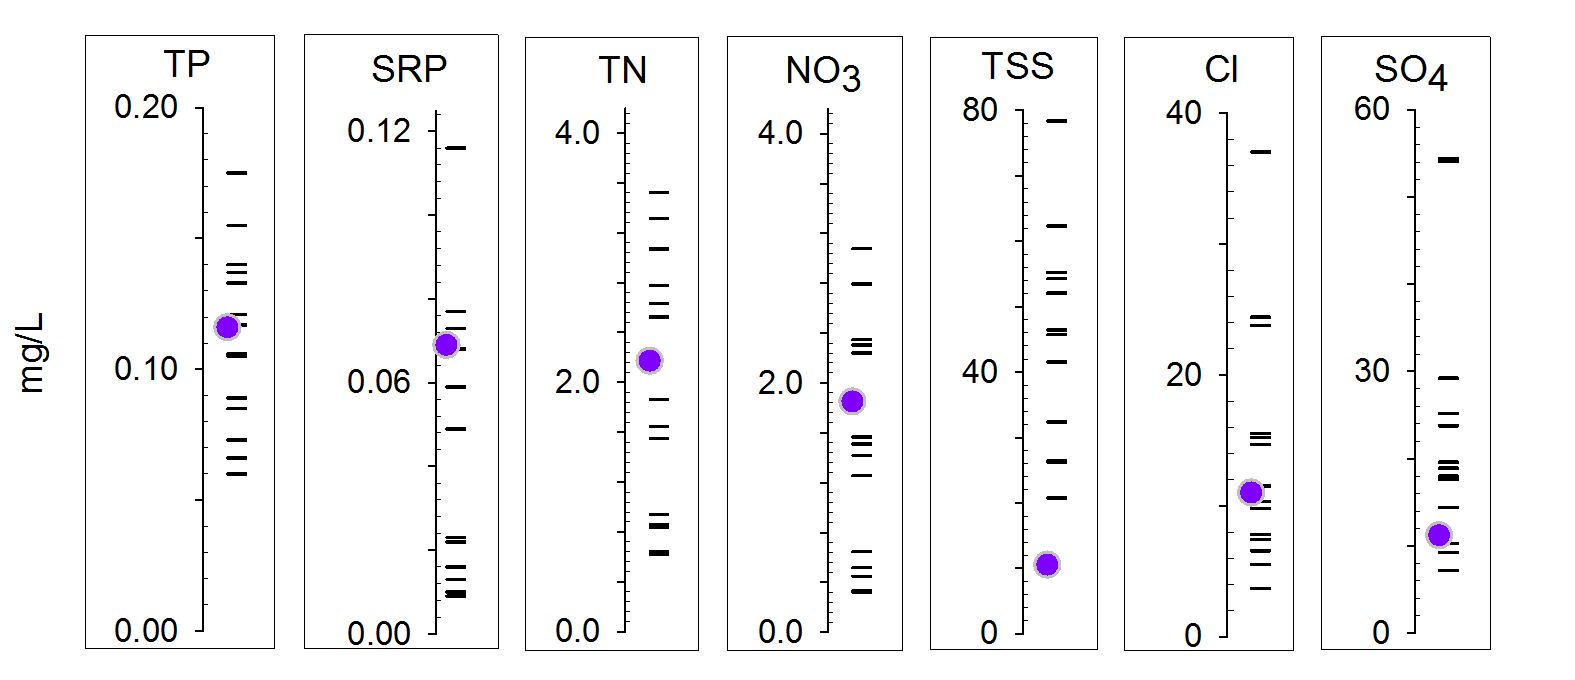
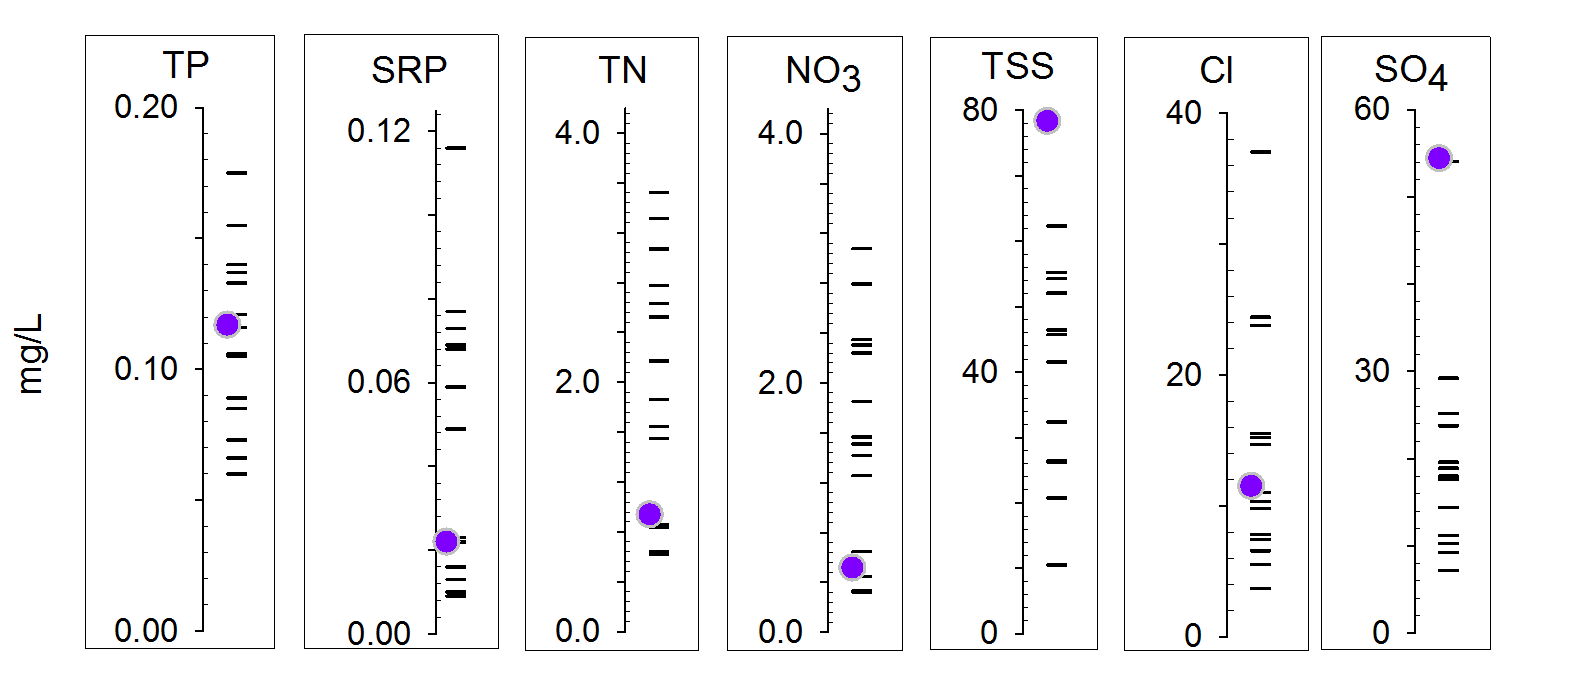
What were the average concentrations between 2009-2018?
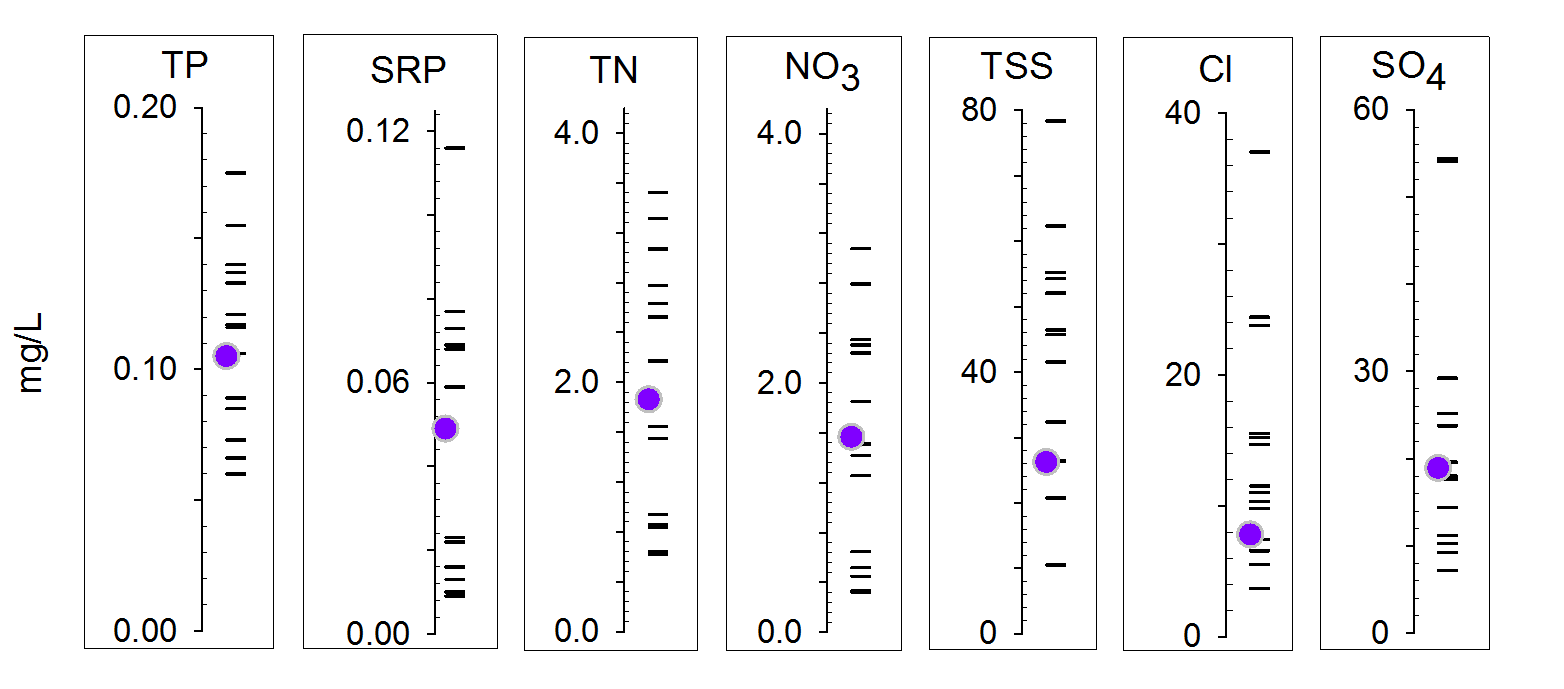
Plot of average water-quality concentrations during the entire study period for all sites. The horizontal markers represent the sites studied during this project and the purple circle represents the average concentrations at the Baron Fork at Dutch Mills. For more detailed information, view the final report for NWA Monitoring.
Flint Creek at Springtown ("FC12")
The Flint Creek watershed at this site is 39 km2, draining 25% forested lands, 69% pasture and grasslands, and 6% urban development in the Upper Illinois River Watershed. Flint Creek is a major tributary to the Illinois River. We stopped monitoring this site in summer 2015.
What were the trends between 2009-2015?
- Nitrate and TN were increasing.
- SRP and TP were increasing.
- Sulfate was increasing.
See the report for more information.
Flint Creek near West Siloam Springs, OK ("FCWSS")
The Flint Creek watershed at this site is 146 km2, draining 27% forested lands, 62% pasture and grasslands, and 10% urban development. Flint Creek is a major tributary to the Illinois River within the Upper Illinois River Watershed.
What were the trends between 2009-2015?
- Nitrate and TN were increasing.
- Total suspended solids was decreasing.
- Sulfate was decreasing.
See the report for more information.
Illinois River at Savoy ("Savoy")
The Illinois River watershed at this site is 435 km2, draining 37% forested lands, 54% pasture and grasslands, and 8% urban development. This site is the most upstream site sampled on the Illinois River.
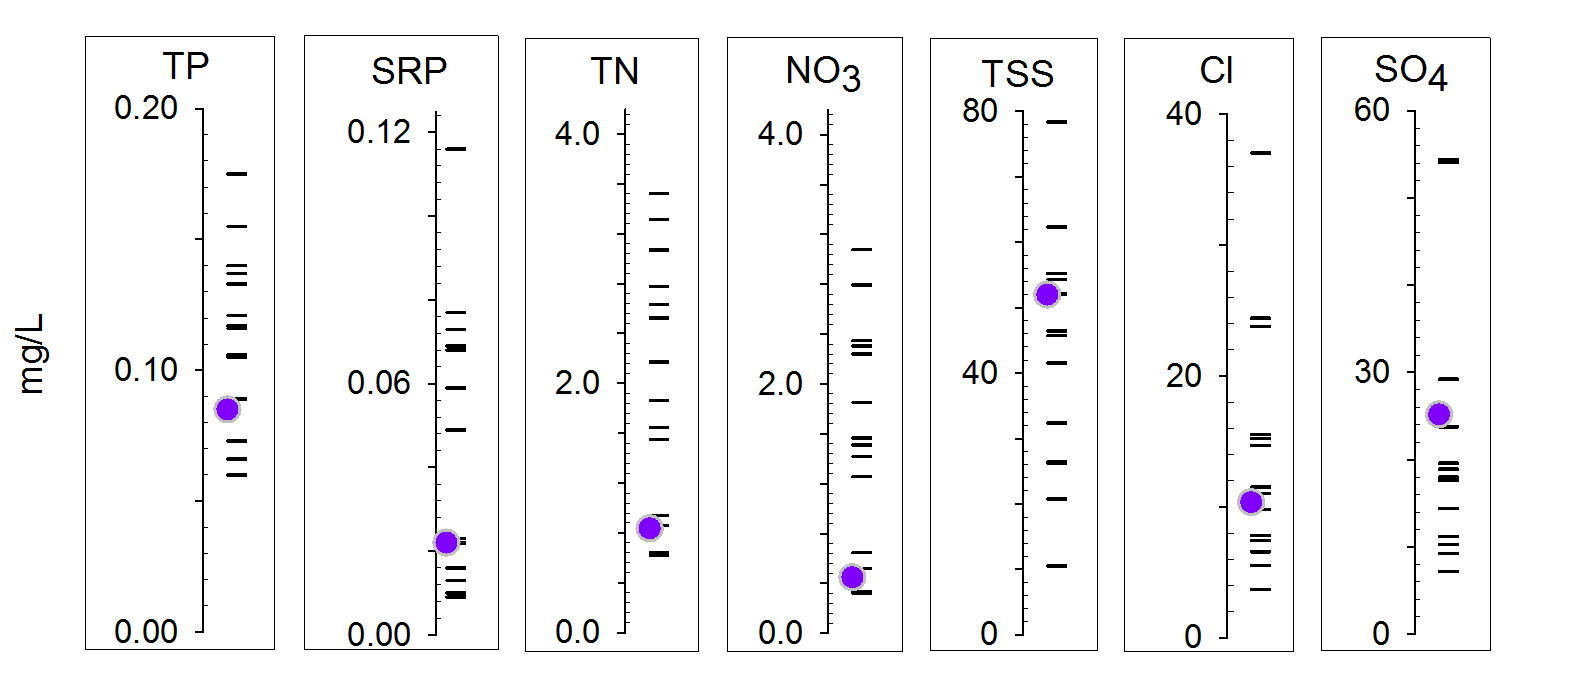
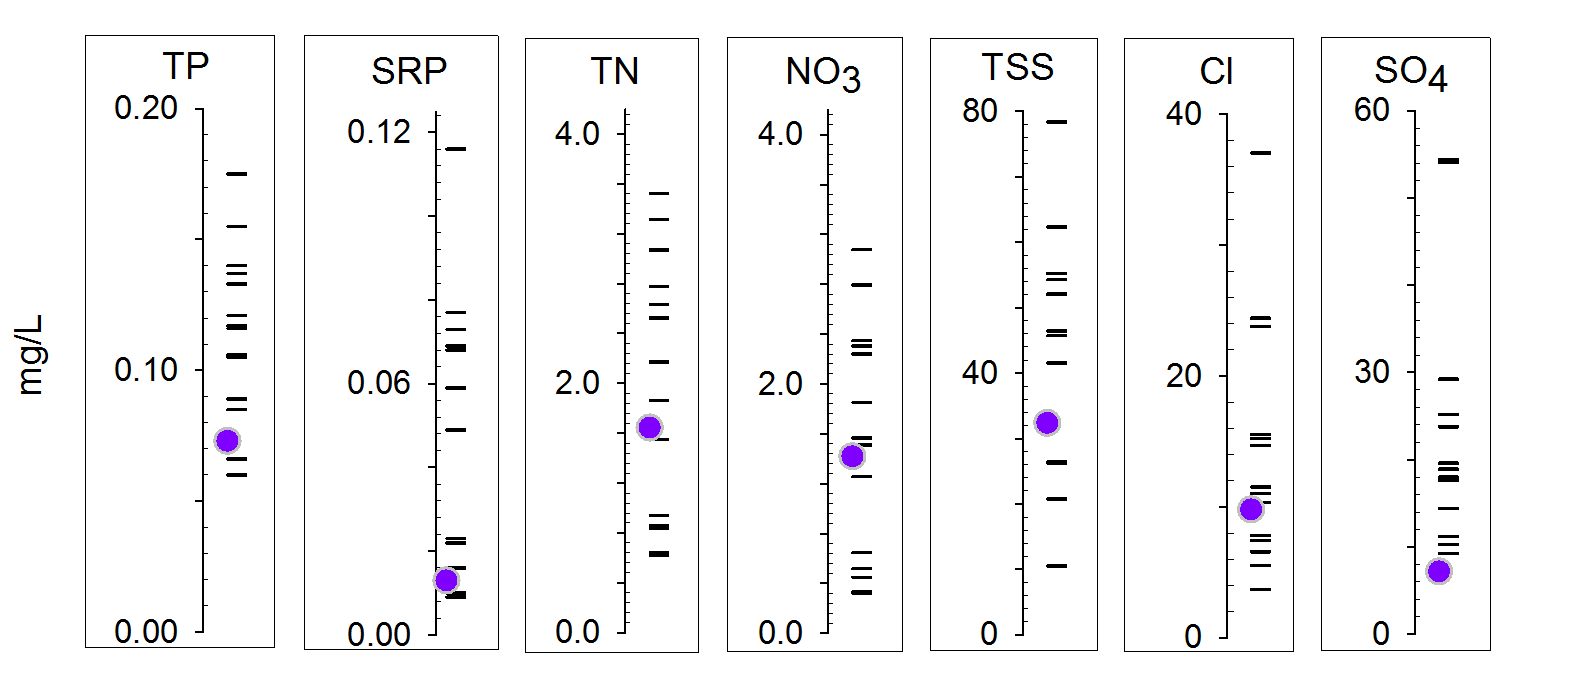
What were the average concentrations between 2009-2018?
Plot of average water-quality concentrations during the entire study period for all sites. The horizontal markers represent the sites studied during this project and the purple circle represents the average concentrations at the Illinois River at Savoy. For more detailed information, view the final report for NWA Monitoring.
Illinois River south of Siloam Springs ("IR59")
The Illinois River watershed at this site is 1,473 km2, draining 29% forested lands, 52% pasture and grasslands, and 19% urban development. The Illinois River at this site is important because its watershed has been the focus of past management activities aiming to reduce phosphorus in the water.
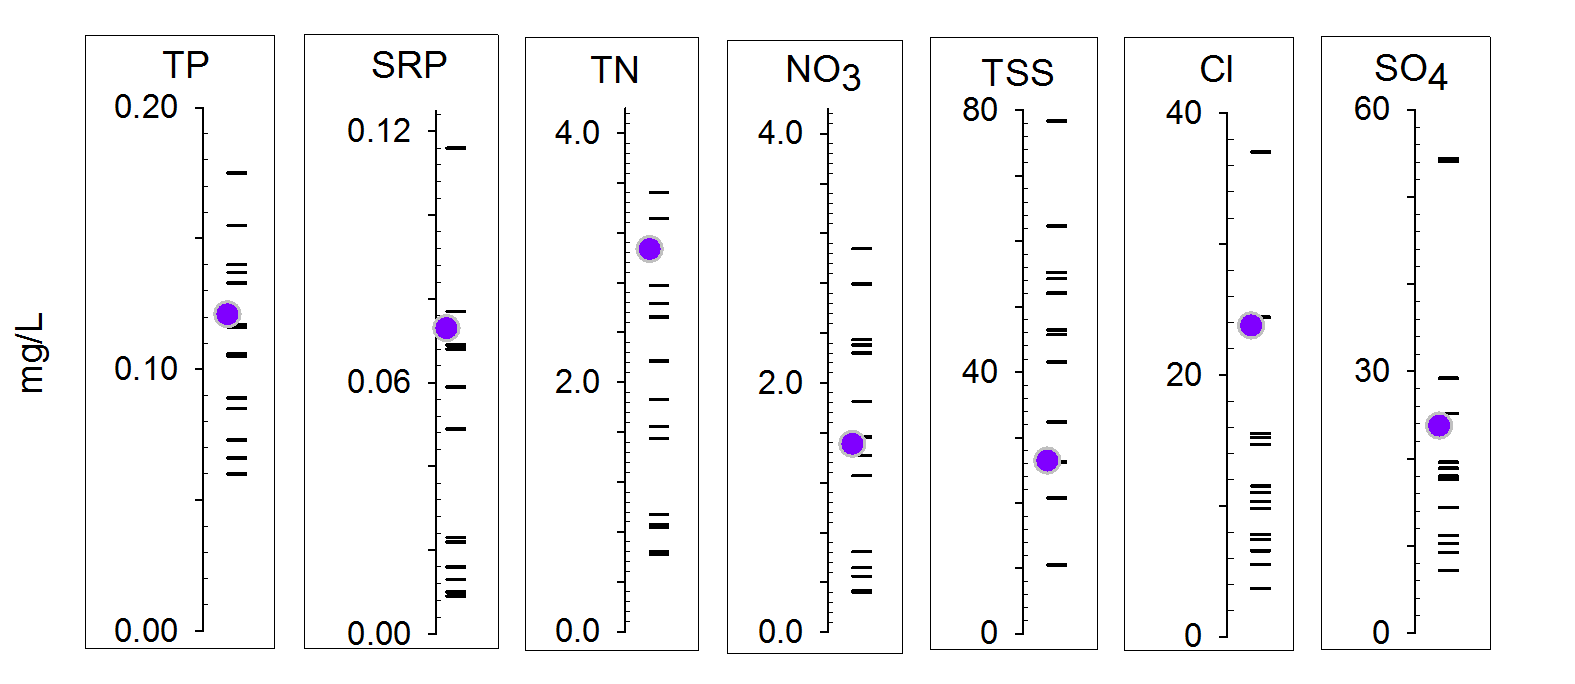
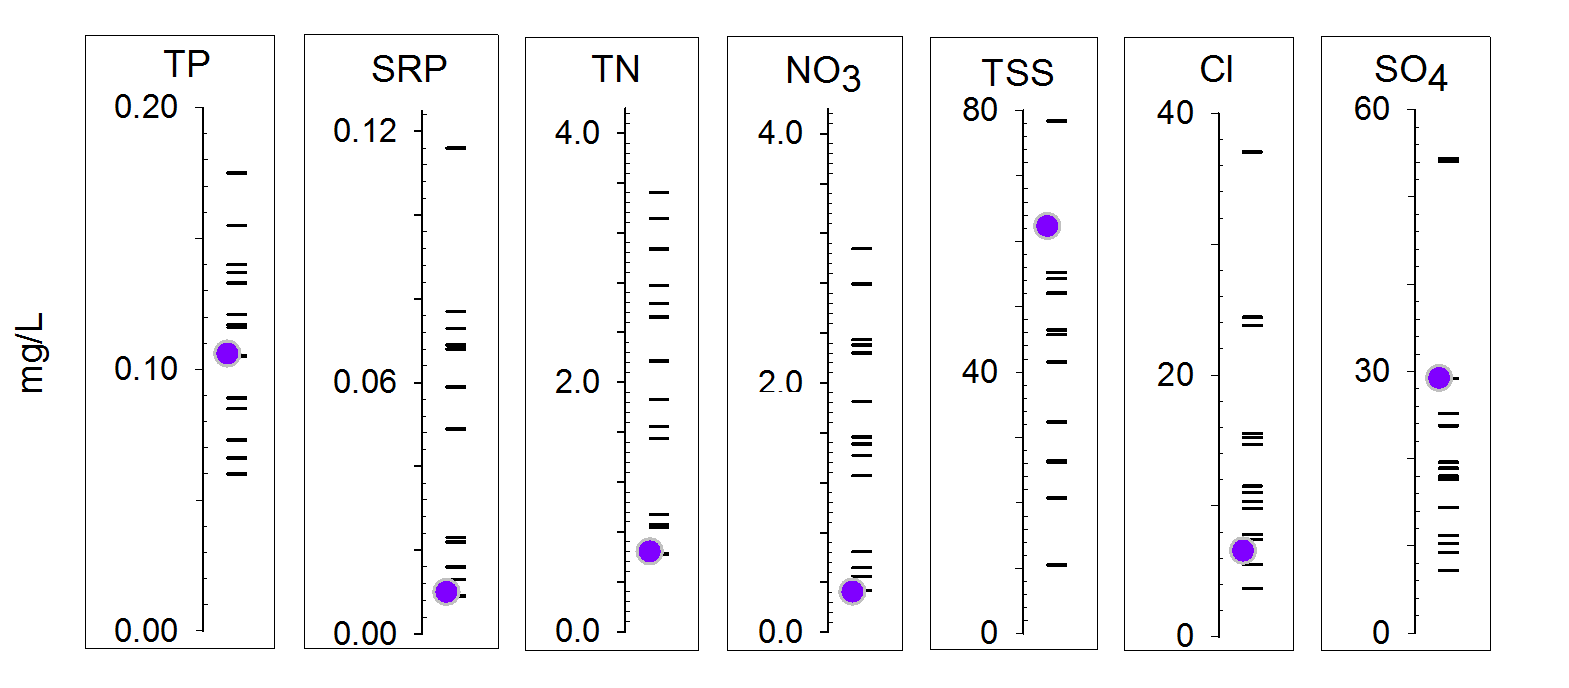
What were the average concentrations between 2009-2018?
Plot of average water-quality concentrations during the entire study period for all sites. The horizontal markers represent the sites studied during this project and the purple circle represents the average concentrations at the Illinois River south of Siloam Springs. For more detailed information, view the final report for NWA Monitoring.
Illinois River near Watts ("Watts")
The Illinois River watershed at this site is 1,634 km2, draining 29% forested lands, 53% pasture and grasslands, and 18% urban development. This site is important because the Illinois River is a focal point for phosphorus management. The site at Watts is just downstream of a small impoundment called Lake Francis, which can affect water quality.
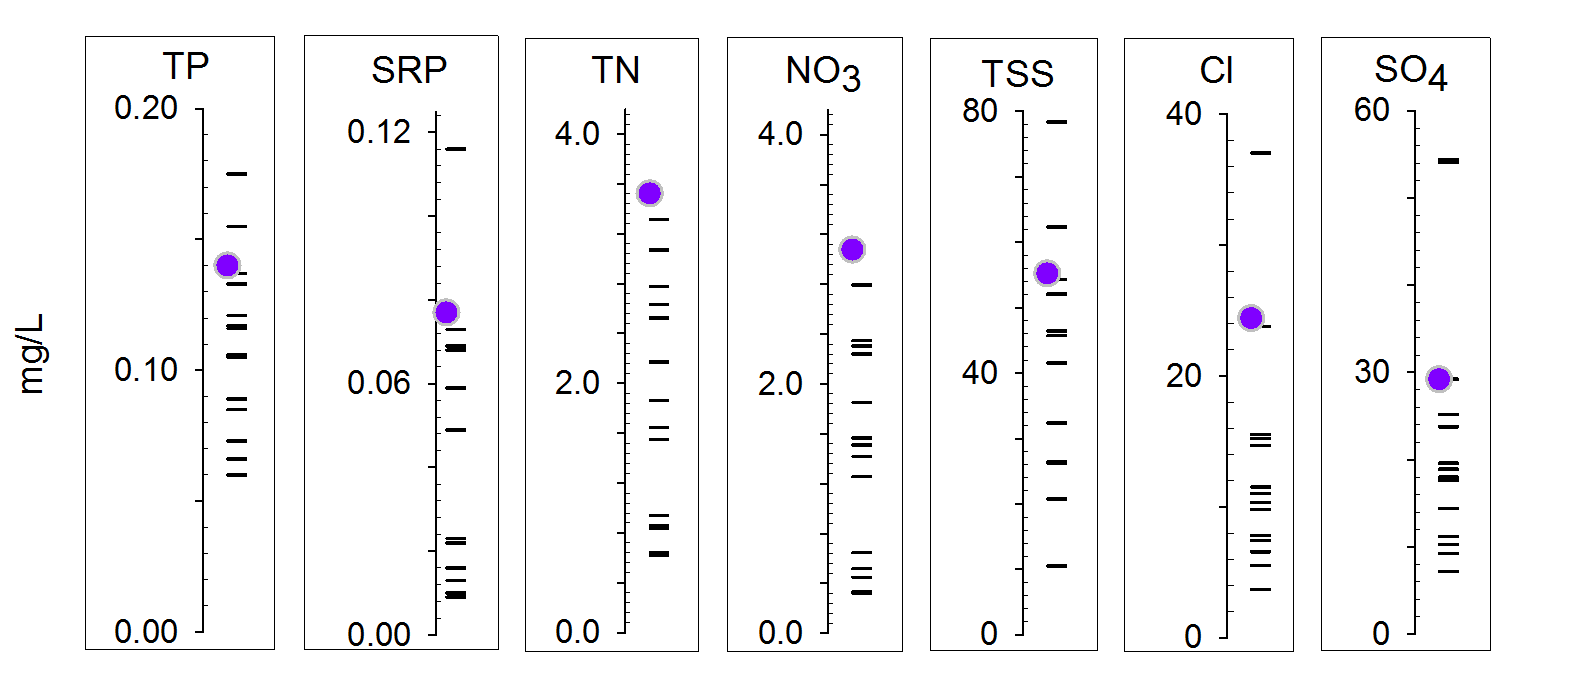
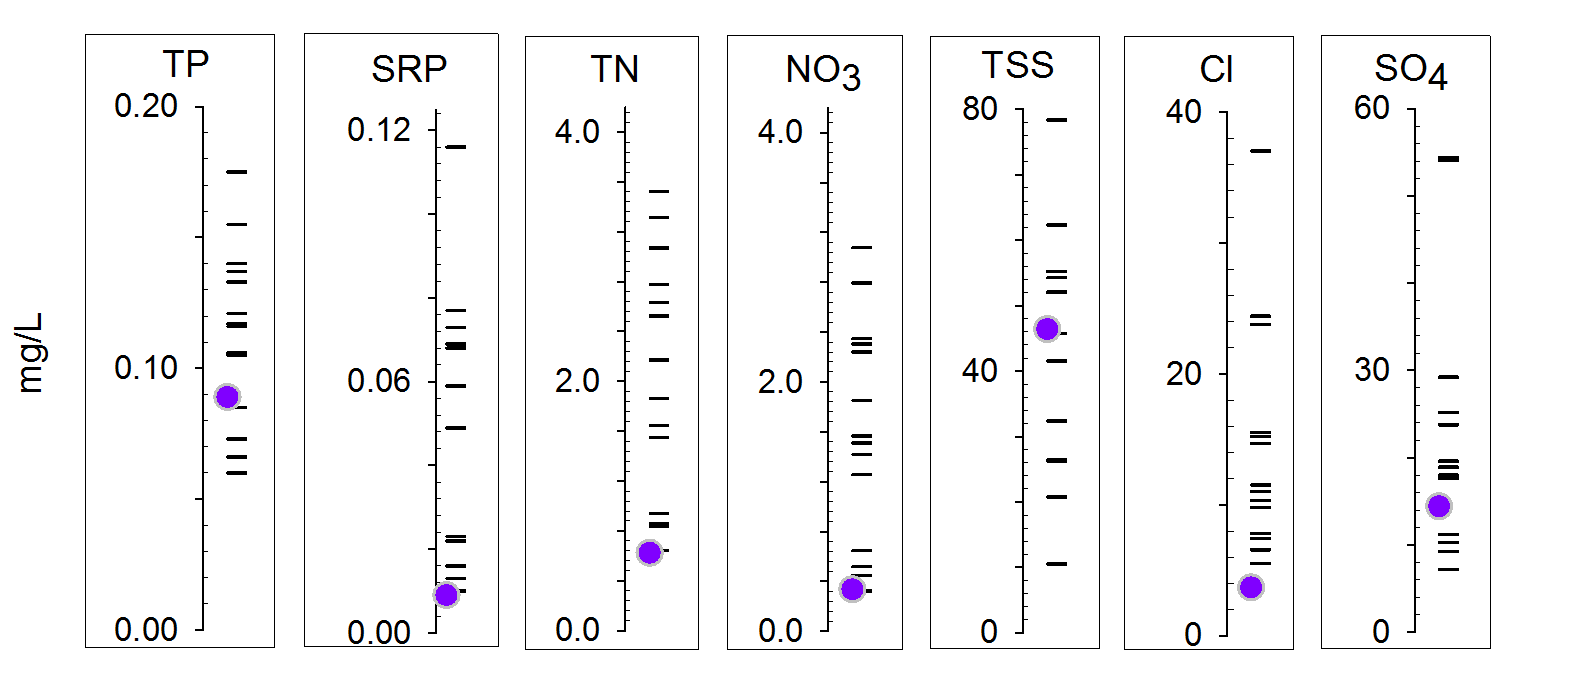
What were the average concentrations between 2009-2018?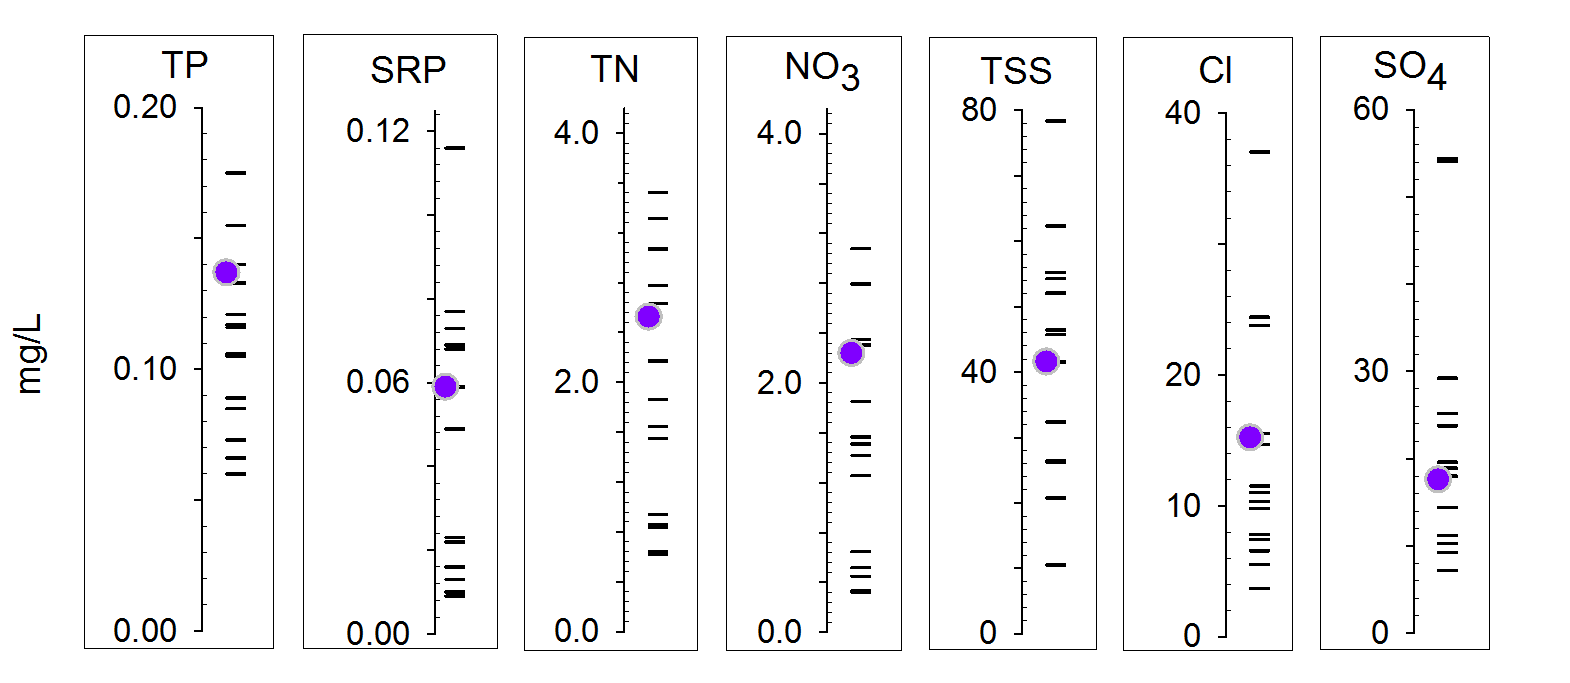
Plot of average water-quality concentrations during the entire study period for all sites. The horizontal markers represent the sites studied during this project and the purple circle represents the average concentrations at the Illinois River near Watts. For more detailed information, view the final report for NWA Monitoring.
Mud Creek near Johnson ("Mud")
We started sampling this site in October 2015. This site drains mostly urban land use, including much of north and east Fayetteville.
What were the average concentrations between 2015-2018?
Plot of average water-quality concentrations during the entire study period for all sites. The horizontal markers represent the sites studied during this project and the purple circle represents the average concentrations at the Mud Creek near Johnson. For more detailed information, view the final report for NWA Monitoring.
Niokaska Creek at Township Street in Fayetteville ("NC")
The Niokaska Creek watershed at this site is 3.1 km2, draining 15% forested lands and 84% urban development. Niokaska Creek is unique because although it is small, it is almost entirely urban land use, and is in the Upper Illinois River Watershed. We stopped monitoring this site in summer 2015.
What were the trends between 2011-2015?
- Chloride was increasing.
- All other parameters were neither increasing or decreasing.
See the report for more information.
Osage Creek near Cave Springs ("OC112")
We started sampling this site in October 2015. This site is almost 11 km upstream from our other sampling site on Osage Creek, and allows us understand water quality from upstream to downstream of where Spring Creek enters Osage Creek.
What were the average concentrations between 2015-2018?
Plot of average water-quality concentrations during the entire study period for all sites. The horizontal markers represent the sites studied during this project and the purple circle represents the average concentrations at the Osage Creek near Cave Springs. For more detailed information, view the final report for NWA Monitoring.
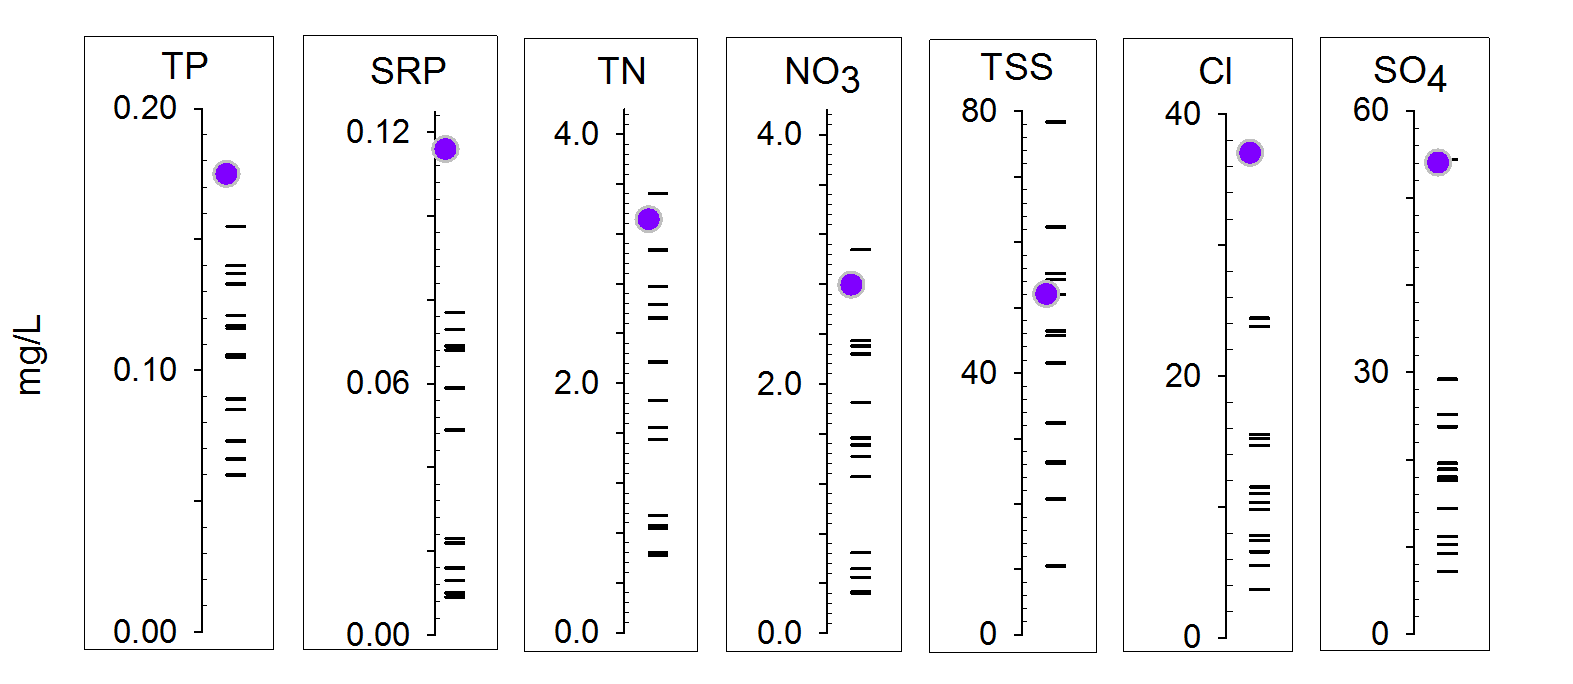
Osage Creek near Elm Springs ("Osage")
The Osage Creek watershed is 337 km2, draining 12% forested lands, 51% pasture and grasslands, and 37% urban development in the Upper Illinois River Watershed. Osage Creek upstream from this site receives waste water effluent from three different treatment plants including the City of Rogers, City of Springdale, and the Northwest Arkansas Conservation Authority.
What were the average concentrations between 2009-2018?
Plot of average water-quality concentrations during the entire study period for all sites. The horizontal markers represent the sites studied during this project and the purple circle represents the average concentrations at the Osage Creek near Elm Springs. For more detailed information, view the final report for NWA Monitoring.
Sager Creek at Siloam Springs ("Sager")
The Sager Creek watershed at this site is 35 km2, draining 4% forested lands, 58% pasture and grasslands, and 38% urban development in the Upper Illinois River Watershed. Sager is a unique site because it has a fairly large urban influence and the City of Siloam Springs has done a lot to improve water quality in Sager Creek.
What were the average concentrations between 2009-2018?
Plot of average water-quality concentrations during the entire study period for all sites. The horizontal markers represent the sites studied during this project and the purple circle represents the average concentrations at the Sager Creek at Siloam Springs. For more detailed information, view the final report for NWA Monitoring.
Spring Creek at highway 112 near Springdale ("Spring")
The Spring Creek watershed at this site is 92 km2, draining 12% forested lands, 43% pasture and grasslands, and 45% urban development. Spring Creek receives wastewater effluent from Springdale’s treatment plant before flowing into Osage Creek in the Upper Illinois River Watershed.
What were the average concentrations between 2009-2018?
Plot of average water-quality concentrations during the entire study period for all sites. The horizontal markers represent the sites studied during this project and the purple circle represents the average concentrations at the Spring Creek at highway 112 near Springdale. For more detailed information, view the final report for NWA Monitoring.
Upper White River Basin
College Branch at MLK Boulevard ("TB62")
The College Branch watershed is a small urban watershed of 2.3 km2, where 93% is urban development, and less than 7% is forested land in the Upper White River Basin. We stopped monitoring at this site in summer 2015.
What were the trends between 2011-2015?
- Nitrate was decreasing.
- TP was increasing.
- Total suspended solids was increasing.
- Chloride was increasing.
See the report for more information.
Kings River near Berryville ("Kings")
The Kings River watershed is 1370 km2, draining 67% forested lands, 28% pasture and grasslands, and 4% urban development. The Kings River is a tributary to the White River within the Upper White River Basin, flowing into Table Rock Lake.
What were the average concentrations between 2009-2018?
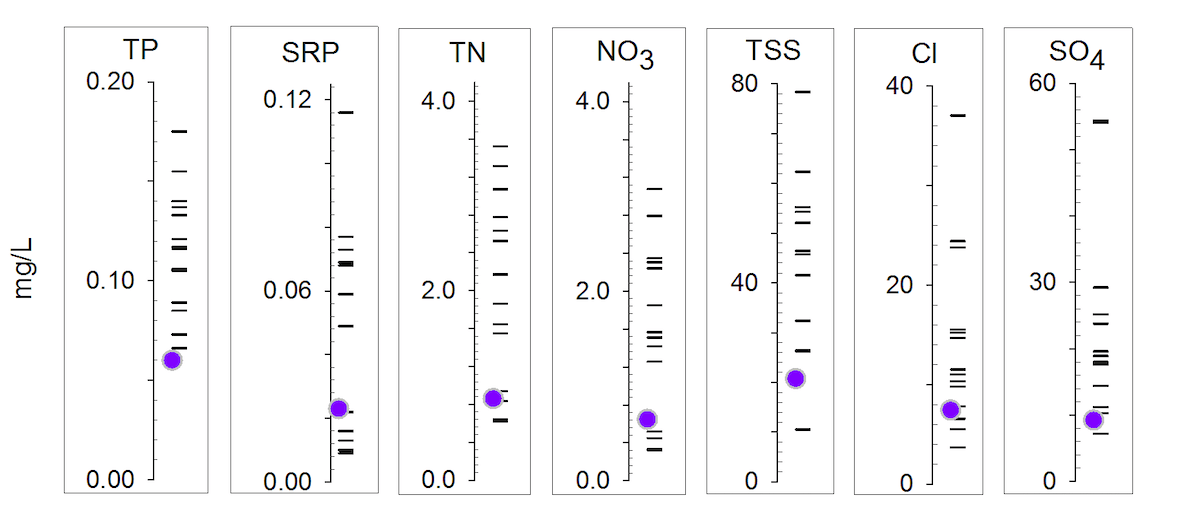 Plot of average water-quality concentrations during the entire study period for all sites. The horizontal markers represent the sites studied during this project and the purple circle represents the average concentrations at the Kings River near Berryville. For more detailed information, view the final report for NWA Monitoring.
Richland Creek on Tuttle Road near Goshen ("Richland")
We started sampling this site in October 2015 instead of at highway 45 near Goshen. This site is about 8 km upstream from the site on highway 45 and is in the Upper White River Basin.
What were the average concentrations between 2015-2018?
Plot of average water-quality concentrations during the entire study period for all sites. The horizontal markers represent the sites studied during this project and the purple circle represents the average concentrations at the Richland Creek on Tuttle Road near Goshen. For more detailed information, view the final report for NWA Monitoring.
Richland Creek on Highway 45 near Goshen ("RC45")
The Richland Creek watershed at this site is 362 km2, draining 58% forested lands, 38% pasture and grasslands, and 4% urban development. Richland Creek is one of the three main tributaries to Beaver Lake (i.e. impoundment of the White River) and is in the Upper White River Basin. We no longer sample Richland Creek at this location, but we do about 8 km upstream.
What were the trends between 2009-2015?
- Nitrate and TN were increasing.
- SRP and TP were decreasing.
- Total suspended solids was decreasing.
- Chloride and sulfate were increasing.
See the report for more information.
Town Branch on Armstrong Street at Fayetteville ("TB")
We started sampling this site in October 2015. This site is just 0.5 km upstream from where Town Branch flows into the West Fork of the White River.
What were the average concentrations between 2009-2018?
Plot of average water-quality concentrations during the entire study period for all sites. The horizontal markers represent the sites studied during this project and the purple circle represents the average concentrations at the Town Branch on Armstrong Street at Fayetteville. For more detailed information, view the final report for NWA Monitoring.
Town Branch Tributary at Highway 16 in Fayetteville ("TBT")
The watershed for this unnamed urban tributary of Town Branch is just 3.3 km2, draining 86% urban development, 13% forested land, and less that 1% is pasture or grassland in the Upper White River Basin. We stopped monitoring at this site in summer 2015.
What were the trends between 2011-2015?
- Chloride and sulfate were increasing.
- All other parameters were neither increasing or decreasing.
See the report for more information.
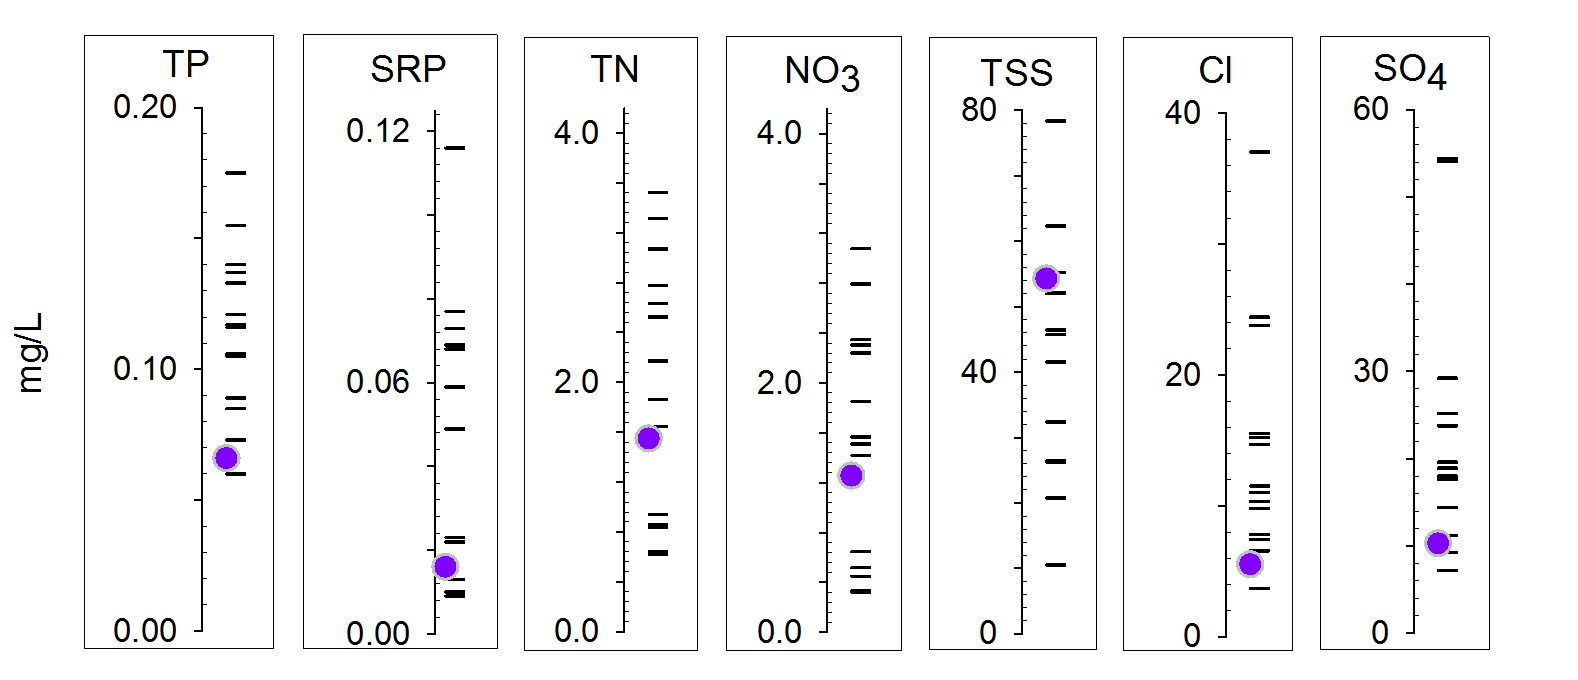
War Eagle Creek near Hindsville ("WEC")
The War Eagle Creek watershed is 690 km2, draining 57% forested lands, 38% pasture and grasslands, and 5% urban development. War Eagle Creek receives the treated wastewater effluent from the city of Huntsville, Arkansas before it flows into Beaver Lake (i.e. impoundment of the White River). War Eagle Creek is part of the Upper White River Basin.
What were the average concentrations between 2009-2018?
Plot of average water-quality concentrations during the entire study period for all sites. The horizontal markers represent the sites studied during this project and the purple circle represents the average concentrations at the War Eagle Creek near Hindsville. For more detailed information, view the final report for NWA Monitoring.
West Fork of the White River at Mally Wagnon Road ("WFWR")
The West Fork of the White River (WFWR) watershed at this site is 317 km2, draining 60% forested lands, 26% pasture and grasslands, and 13% urban development. The WFWR flows into the White River just downstream of Lake Sequoyah in the Upper White River Basin.
What were the average concentrations between 2009-2018?
Plot of average water-quality concentrations during the entire study period for all sites. The horizontal markers represent the sites studied during this project and the purple circle represents the average concentrations at the West Fork of the White River. For more detailed information, view the final report for NWA Monitoring.
White River at Wyman Road ("Wyman")
The White River watershed at this site is 1032 km2, draining 69% forested lands, 23% pasture and grasslands, and 7% urban development. This site is just upstream of the wastewater effluent discharge from the Paul Noland Treatment Facility east of Fayetteville. The White River forms Beaver Lake, the drinking water supply for northwest Arkansas.
What were the average concentrations between 2009-2018?
Plot of average water-quality concentrations during the entire study period for all sites. The horizontal markers represent the sites studied during this project and the purple circle represents the average concentrations at the White River at Wyman Road. For more detailed information, view the final report for NWA Monitoring.